Frequently Asked Questions
Where are the stations located?
- You can find station names, lat/longs, land use, and corresponding USGS gage number with links here.
- This information is also in our study plan here.
How do I cite this data?
NCWQR. 2022. Heidelberg Tributary Loading Program (HTLP) Dataset. Zenodo. https://doi.org/10.5281/zenodo.6606949
How is flow calculated?
- Each of our stations is co-located at a USGS gaging station. We use flow determined by them.
- Flow in the data portal is provisional data acquired at the time of sampling. For any official loading estimations, USGS data should be downloaded directly.
Why is there a negative data point?
It is routine practice in analytical chemistry to determine method detection limits and/or limits of quantitation, below which analytical results are considered less reliable or unreliable. This is something that we also do as part of our standard procedures. Many laboratories, especially those associated with agencies such as the U.S. EPA, do not report individual values that are less than the detection limit, even if the analytical equipment returns such values. This is in part because as individual measurements they may not be considered valid under litigation.
The measured concentration consists of the true but unknown concentration plus random instrument error, which is usually small compared to the range of expected environmental values. In a sample for which the true concentration is very small, perhaps even essentially zero, it is possible to obtain an analytical result of 0 or even a small negative concentration. Results of this sort are often “censored” and replaced with the statement “<DL” or “<2”, where DL is the detection limit, in this case 2. Some agencies now follow the unfortunate convention of writing “-2” rather than “<2”.
Censoring these low values creates a number of problems for data analysis. How do you take an average? If you leave out these numbers, you get a biased result because you did not toss out any other (higher) values. Even if you replace negative concentrations with 0, a bias ensues, because you’ve chopped off some portion of the lower end of the distribution of random instrument error.
For these reasons, we do not censor our data. Values of -9 and -1 are used as missing value codes, but all other negative and zero concentrations are actual, valid results. Negative concentrations make no physical sense, but they make analytical and statistical sense. Users should be aware of this, and if necessary make their own decisions about how to use these values. Particularly if log transformations are to be used, some decision on the part of the user will be required.
What exactly do you analyze for?
- We analyze for various forms of phosphorus (dissolved reactive P, total P), nitrogen (ammonium, nitrite, nitrate, total Kjeldahl N), other anions (chloride, sulfate), soluble reactive silica, and total suspended solids.
- For some locations, we have multiparameter YSI EXO sondes deployed to analyze turbidity, dissolved oxygen, pH, conductivity, and temperature. This data is collected every 30 minutes.
- For more information, see our study plan and quality assurance plan.
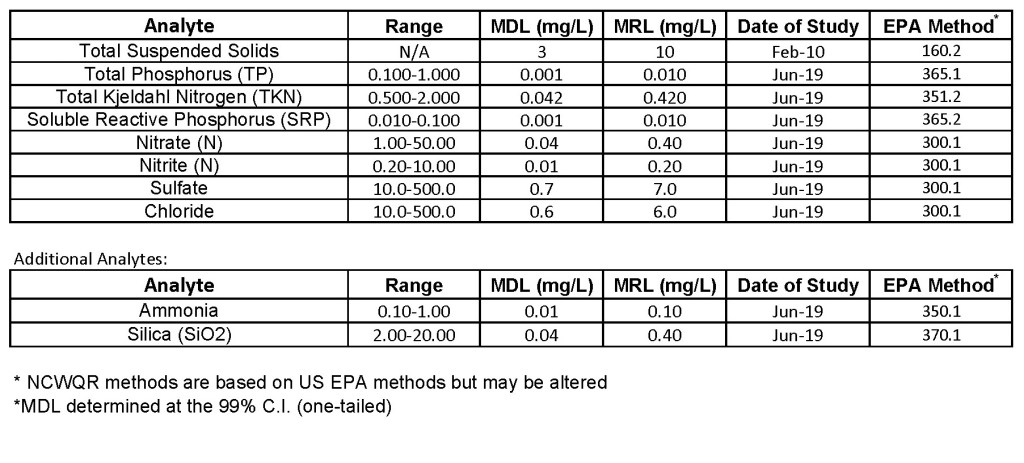
What are the detection limits for each analyte?
How are your data certified?
- We participate in the USGS inter-laboratory comparison study annually
- We also certify our data through Phenova
- See our quality assurance plan for details on our QA/QC program
How do you calculate loads?
- In general, loads are calculated by multiplying discharge by concentration and summing over a specific period of time. Usually this is done on a daily basis and summed over a year. The challenge arises when data is missing- how do you fill in that missing data appropriately? Luckily, we typically are missing less than 5% of the days in a year. This means most load estimators using the observed data do an equally good job. That being said, below are more specifics of our approach.
- Annual loads are calculated using a stratified Beale Ratio Estimator program called autoBeale developed by Pete Richards. We’re in the process of translating this method to an R version. More specifically, for days on which sample concentrations are available, daily loads are calculated as the product of the daily mean discharge from USGS records and a flow weighted mean concentration for that day. The year is divided into sequential time intervals called strata, within which the daily loads were fairly consistent with each other. Within each stratum, an average daily load was computed from the days with samples; this load was adjusted by the ratio of the average discharge for all days in the stratum divided by the average discharge on days with samples, with an additional bias correction related to the variance in discharge and the covariance of discharge and load. Each stratum load is the product of the adjusted average daily load and the number of days in the stratum. Stratum loads were summed to obtain the annual load.
- Daily loads are calculated as described above- as the product of the daily mean USGS discharge and daily flow weighted mean concentration for that day. When concentration is missing for a given day, it is estimated either by interpolation across concentrations from the days before and after that date or by a concentration/discharge relationship determined from data collected within 6 weeks of the missing date. However, we are transitioning this method to the USGS LOADFLEX model for future data.
How do I create an account for the data portal?
To access the NCWQR data, first, you must register and create an account
- At the top of the screen, click on the word “Register”
- Fill out the form as given, making sure to complete every item
- Click the register button at the bottom of the page
- You should receive an email shortly to confirm your account, it may take a few minutes or end up in your spam folder (email comes from “HTLP Data Portal Administrator”)
- From the email, click the link given and your account will be registered
